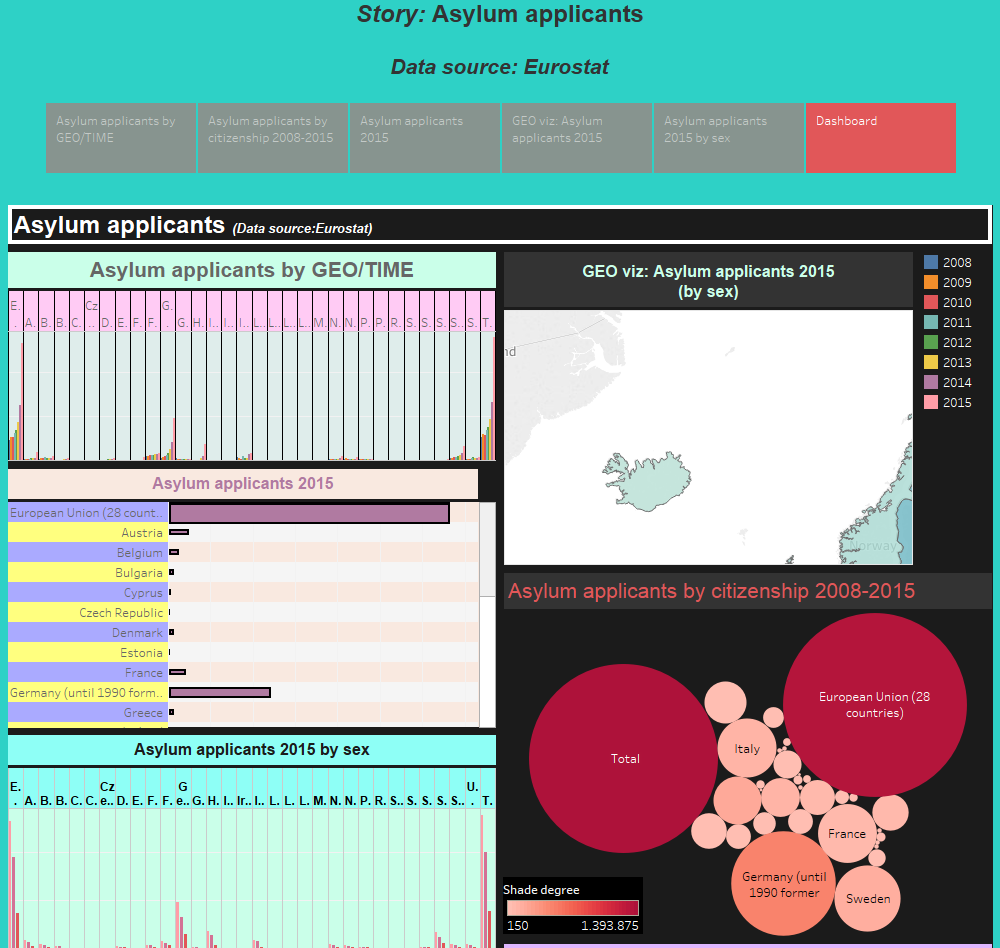
This link provides a data visualization on asylum applicants from 2008 till 2015. More specifically, this showcase shows the asylum and first time asylum applicants by citizenship, age and sex annual using aggregated data. This viz was created by Papanikou Vasiliki, a graduate student of the Department of Applied Informatics, who performed it using Tableau Public. The Dashboard contains a set of charts/diagrams, which are called “Asylum Applicants by GEO/TIME”, “Asylum applicants by citizenship 2008-2015”, “Asylum applicants 2015”, “Geo viz: Asylum applicants 2015” and “Asylum applicants 2015 by sex”. The data were taken from the official Eurostat's page. (Source: Eurostat)