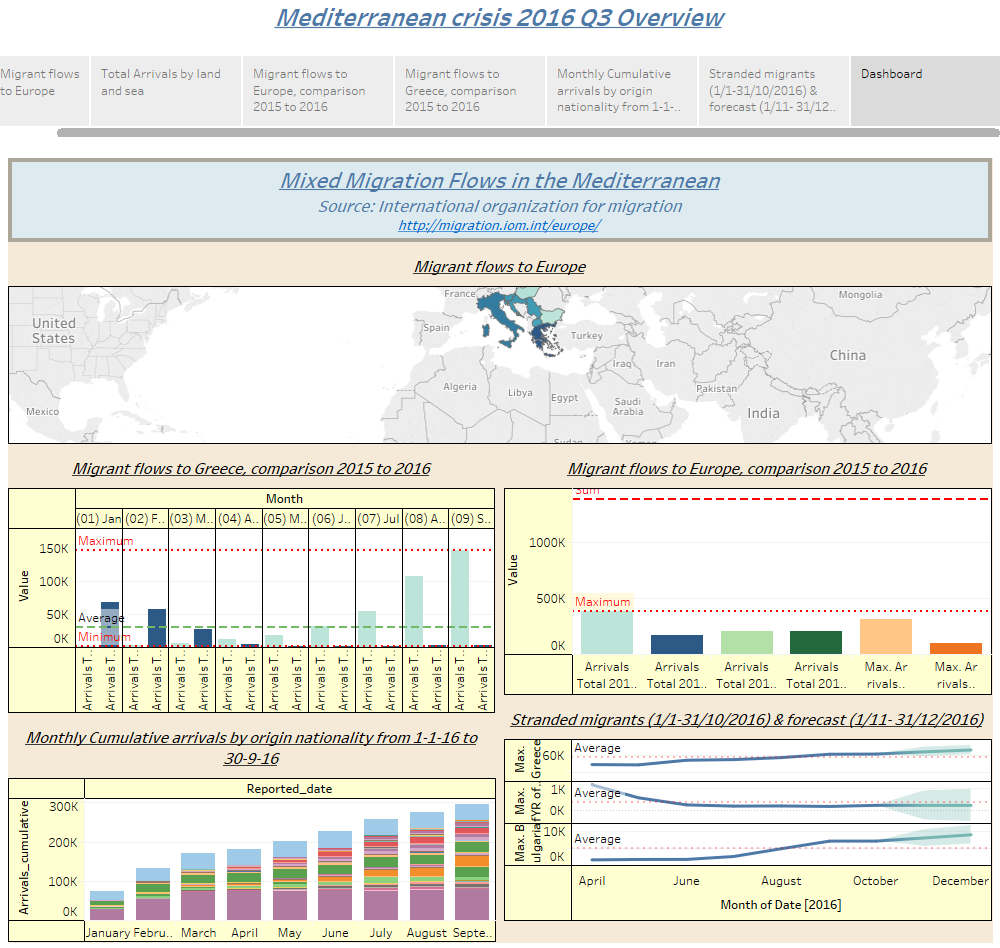
This showcase shows a data visualization about the mixed migration flows in the Mediterranean in 2016 (Q3 overview). It contains the migrant flows to Europe by land and sea and makes comparison between 2015 and 2016. It also contains forecast about the stranded migrants in the last quarter of 2016. The source of this showcase is the International organization for migration. This showcase has been created for educational perposes from a student of MSc in Applied Informatics, University of Macedonia, Greece 2016, called George Baltzis in order to take place in the Tableau contest.